PPSC PAST PAPERS ALL MCQS 2024 OF COMPUTER
PPSC 5 years Subject wise Past Papers Click here
Show Answers
چار آپشن میں سے کسی ایک پر کلک کرنے سے جواب سرخ ہو جائے گا۔
ورڈ پروسیسنگ سافٹ ویئر میں عام طور پر کون سا فائل فارمیٹ کھولا جاتا ہے؟
MS Doc
XLX
PDF
None of these
اس سوال کو وضاحت کے ساتھ پڑھیں
Explanation
MS Doc (Microsoft Word Document) is a file format that is typically opened in word processing software.
Such as Microsoft Word, Google Docs, or LibreOffice.
مندرجہ ذیل میں سے کون سی آٹومیٹک ٹیکسٹ فارمیٹنگ کی مثال ہے؟
Adjusting extra space
Underlining hyperlink
Replacing two -‘s with an em hyphens
All of above
اس سوال کو وضاحت کے ساتھ پڑھیں
Explanation
Automatic text formatting refers to the feature in word processing software that automatically applies formatting to text as you type.
The examples listed are all common types of automatic text formatting:
Adjusting extra space : Automatically removing extra spaces between words or sentences. Underlining hyperlinks : Automatically underlining links to distinguish them from regular text. Replacing two hyphens with an em dash (—) : Automatically replacing two hyphens with a single em dash.
عنوانات اور سرخیوں کے لیے کون سے قسم کے فونٹس بہترین ہیں؟
Text fonts
Picture fonts
Serif fonts
Sans serif fonts
اس سوال کو وضاحت کے ساتھ پڑھیں
Explanation
Sans serif fonts , such as Arial, Helvetica, and Calibri, are best suitable for titles and headlines because they are clear, legible, and grab attention.
They have a clean and modern appearance, making them perfect for headings and titles .
Digital Signature
Encryption
Password
Spam Filter
اس سوال کو وضاحت کے ساتھ پڑھیں
Explanation
A digital signature verifies the authenticity of an email by confirming the sender's identity and ensuring the message hasn't been altered.
It uses cryptography to validate the sender's identity and ensure the integrity of the email content.
ایکسل میں کتنی قسم کے حوالہ جات استعمال کیے جاتے ہیں؟
4
5
3
2
اس سوال کو وضاحت کے ساتھ پڑھیں
Explanation
Excel uses three types of references:
Relative Absolute Mixed These determine how cell references adjust when formulas are copied across cells.
سال 2021 میں دو ملازمین کی کارکردگی کا موازنہ کرنے کے لیے آپ کس قسم کا چارٹ استعمال کریں گے؟
Column Chart
Line Chart
Pie Chart
Dot Chart
اس سوال کو وضاحت کے ساتھ پڑھیں
Explanation
A column chart is ideal for comparing the performance of two employees in 2021 because it allows for a side-by-side comparison of their performance metrics, such as sales, productivity, or revenue.
Pie Chart : Shows how different components contribute to a whole.
Dot Chart : Displays a small number of data points.
Column Chart : Compares performance metrics side-by-side.
Line Chart : Shows trends over time.
6
7
8
5
اس سوال کو وضاحت کے ساتھ پڑھیں
Explanation
The formula evaluates as:
(7-3)×(4+3)/4 = 4×7/4 = 28/4 = 7 .
ڈراپ کیپ کے لیے لائنوں کی ڈیفالٹ تعداد کتنی ہے؟
10
3
15
20
اس سوال کو وضاحت کے ساتھ پڑھیں
Explanation
A drop cap is a large capital letter at begin of a paragraph that, typically, has the depth of two or more lines of normal text.
It is set to ' 3 ' by default , although any choice from 2 onwards.
Drop Cap is an enlarged capital letter of a Word at the beginning of the paragraphs
Drop Cap usually sees in Novels and Newspapers.
What is the maximum number of lines you can set for a drop cap? 10 Drop Cap option found in which menu? Insert Why Drop Caps are used in documents in Ms. Word? To begin a paragraph with a large dropped initial capital letter
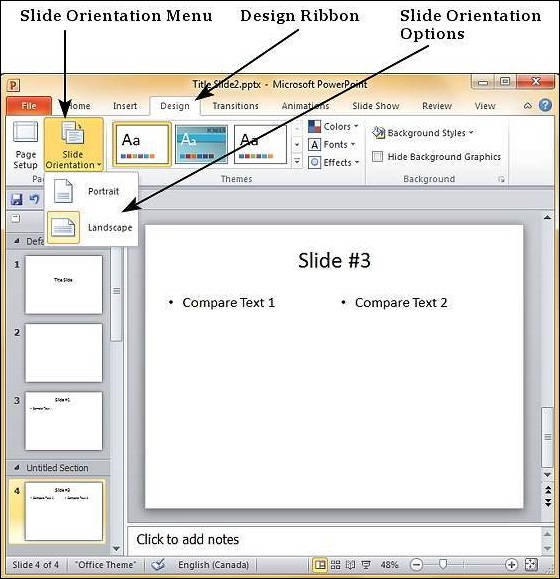
ایم ایس پاورپوائنٹ میں سلائیڈ کی سمت بندی کا طے شدہ صفحہ کون سا ہے؟
Horizontal
Portrait
Landscape
None of these
اس سوال کو وضاحت کے ساتھ پڑھیں
Explanation
The default for PowerPoint slides is landscape
Landscape orientation generally refers to the camera's orientation in a horizontal display .
Pie chart
Bar chart
Line graph
Scatter plot
اس سوال کو وضاحت کے ساتھ پڑھیں
Explanation
Pie charts
• Pie charts are used to show parts of a whole.
• Specifically, pie charts illustrate meaningful relationships between percentages or parts of 100%.
• If the data that we want to display adds up to 1 00%, a pie chart is the best choice.
• When creating a pie chart, the description of each section is called the category, and the number connected to the category is called the value.